|
3-D Spectral Analysis Results Dialog
|   |
|
3-D Spectral Analysis Results Dialog
| |
The 3D Spectral Analysis Results dialog can be accessed from the 2D Spectral Results dialog, by pressin on the 3D menu button. This dialog allows the user to visualize the relationship between three variables as a 3D surface or scatter plot. Figure 12 shows the dialog.
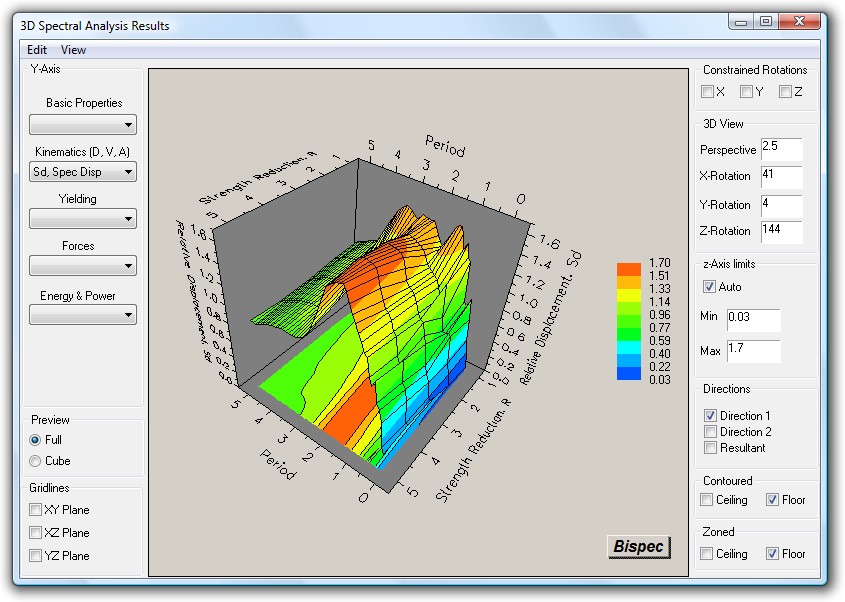
Figure 12: 3D Spectral Analysis Results Dialog
3D Dialog Controls
The 3D dialog has many controls to customize the appearance of the chart and the data. These controls are described below.
Constrained Rotations
Only one of X,Y and Z constraints can be checked at a time. When the user interactively tries to rotate the chart, if one of the constraints is checked, the chart would rotate only about the checked axis.
3D View
Four edit boxes that serve as both input and output boxes. They allow the user to enter the view perspective and rotations and see the updated chart view. If the user rotates the chart using the mouse, those boxes are updated with the new values.
The "Perspective" box defines the perspective of the view. This value should be larger than 1. A value of 1 gives maximum perspective effect, while a large number removes perspective effects.
X Rotation is the rotation around the horizontal axis of the screen
Y Rotation is the rotation around the axis perpendicular to the screen
Z Rotation is the rotation around the vertical axis of the screen
Z-Axis Limits
This includes an "Auto" checkbox and two edit boxes, for the minimum and maximum limits on the z-axis. When Auto is ON, the chart automatically determines the minimum and maximum limits on the axis, and updates the edit boxes. When OFF, the chart limits will be determined by the values entered by the user for minimum and maximum. The chart goes back to Auto when a new plot is generated.
Directions
Three checkboxes for: Direction 1, Direction 2 and Resultant (Maximum combination of both directions). Only Direction 1 is available for 1-D analysis. Only one of the three selections can be active.
Contoured
Specifies whether the top (ceiling) or bottom (floor) faces of the chart box have contour lines.
Zoned
Specifies whether the top (ceiling) or bottom (floor) face of the chart box have contour colors.
Preview
Can be either "Cube" or "Full". Determines whether the chart regenerates during rotation (Full) or whether only the outline of the plot cube is shown (Cube). When the window is created, this is usually On, unless the number of points is more than 1000, in which case it's set to Off to avoid excessive regeneration time.
Gridlines
Three checkboxes to select whether to turn gridlines On or Off on the three planes: XY, XZ, YZ.