|
2D Spectral Analysis Results Dialog
|   |
|
2D Spectral Analysis Results Dialog
| |
The 2D Spectral Analysis Results dialog is the default window that appears when a spectral analysis is requested. The window is interactive, and provides a animated progressive display of the results while the computation is being performed. Figures 10 and 11 show the dialog during an analysis and after the analysis is done.
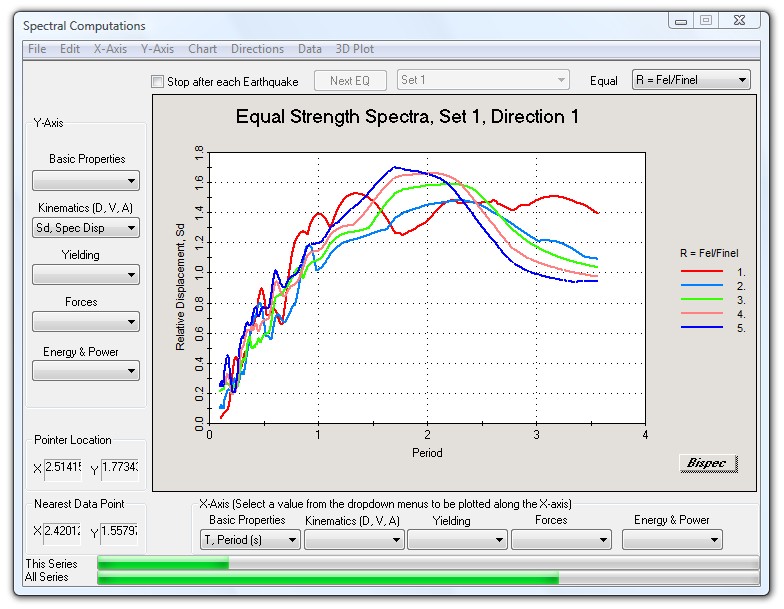
Figure 10: 2D Spectral Analysis Results Dialog being while the analysis is being performed (5000 periods and 5 strength R values)
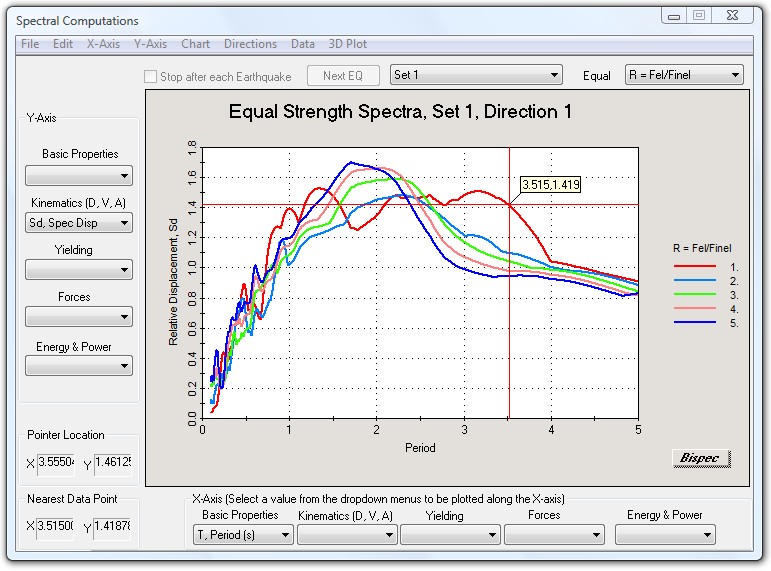
Figure 11: 2D Spectral Analysis Results Dialog beingat the end of the analysis
The dialog contains numerous controls and menu items that give the user wide options for plotting various quantities and controlling the look of the chart.
2D Dialog Controls and Menus
The 2D dialog has many controls to customize the appearance of the chart and data series. These controls include drop-down combo boxes that allow the selection the variable to be plotted on the x and y axes. This allows plotting any two variables against each other.
Edit Menu
Allows the chart to be copied to the clipboard for pasting into other documents (for example a Word editor or spreadsheet such as Microsoft Word or Excel).
X-Axis Menu
Provides a selection between a linear or logarithmic x-axis scale.
Y-Axis Menu
Provides a selection between a linear or logarithmic y-axis scale.
Chart Menu
Directions Menu
Three checkboxes for: Direction 1, Direction 2 and Resultant (Maximum combination of both directions). Only Direction 1 is available for 1-D analysis. In general, only one of the three selections can be picked in 2D analysis. An exception to that is when there is only one series, in which case, 1, 2 or 3 of these options can be checked simultaneously, and the different direction quantities can be plotted on the same chart, one series per direction.
The data menu provides numerous options for exporting spectral results to one or multiple text files:
The results are always saved in one text/data file per quantity record.
See more details below under "Data Export" below.
3D Plot Menu Button
Features a "3D Plot" menu button, which calls the 3-D plotting window.
Value text boxes that display two sets of chart coordinates:
"Equal Value" drop-down (combo box) that allows choosing the variable to be used to connect points into series. This allows the data to be viewed in two different ways (for same X and Y quantities). By default, BiSpec will initialize the selection such that the minimum number of series is displayed.
A ground motion drop-down box that allows the user to select the ground motion record for which results should be displayed. The drop-down box also has options for displaying statistical information for all the records such as:
Spectral analysis results can be exported from the program by writing them to a data file. Since the program computes and saves about 61 quantities for each analysis, and performs a number of analyses determined by varying two parameters (period and strength/ductility), the number of results cam become very large. And since the user might only be interested in only one quantity, it is possible to only save the data of the displayed plot. It is also possible to export all spectral quantities for a given record, or spectral results for multiple records (see "Data Menu" section above). The data can be written out in one of two formats:
1. General format: When this format is selected, each series in the plot is written out as two columns, for the X and Y values respectively. So if there were Ns series in the plot with Nd number of points each, they would be written as 2Ns columns with Nd rows in each. A header row is added which carries the value of the series parameter for each series. Example: Sa vs Sd.
2. Array format: This option if available when the X-axis data is one of the parameters used for the analysis (period for example). In this case, the X values would be shared between all the series, and only one column would be needed for the X values (first column) with N columns for the Y data, for a total of N+1 columns. Again, a header row is added which holds the parameter that distinguishes the series. Example: Sa vs T.
The user can pick one of the applicable data export format in a small dialog that is displaced upon clicking on the "Save Data" button.