|
Single Dynamic Analysis Results Window
|   |
|
Single Dynamic Analysis Results Window
| |
For a single analysis, several histories are computed. The user can pick time or any of the computed quantities for any of the plot axes. That gives a flexibility of plotting any two quantities in terms of each other.
When the analysis is bidirectional, two plot series are generated, one for each direction. An exception to that is if the analysis is bidirectional and the user picks two similar quantities, like displacement vs. displacement. BiSpec will generate a 2D interaction plot in this case (1 series only), plotting the displacement in direction 1 vs. the displacement in direction 2, which is the path of the pendulum system in xy plane. The quantities to be plot on different axes can be conveniently picked by pushing buttons below and next to the X and Y axes of the plot. The dialog has some "shortcut" buttons to help the user quickly generate preferred plots. Those buttons generate:
The inertia force is defined as the total acceleration multiplied by the mass.
The following is a list of variables that can be plotted for single dynamic analysis:
Items 1-7 above can be plotted on the X-axis, while items 1-17 can be plotted on the Y-axis.
The dialog contains text boxes (bottom right in Figure 8) showing the maximum values of the x and y-axis data. Four values are provided, those are maximum X and maximum Y (in absolute terms), for both directions of analysis. Two other text boxes provide the instantaneous coordinates pointed to by the mouse cursor. Those values change continuously as the mouse is moved over the plot.
The dialog also has two buttons "Animate" and "Save Data". The "Animate" button launches the "Animation Window" which can be used visualize the 3-dimensional motion of the pendulum system (see next section). The "Save Data" button can be used to export the displayed history data to a text file for later processing.
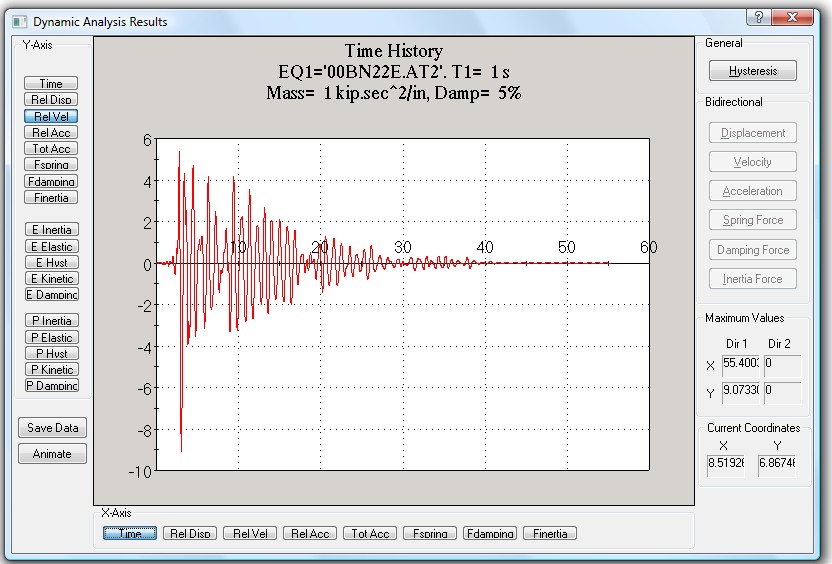
Figure 8: Hysteresis Plot