|
Nonlinear Spectra
|   |
|
Nonlinear Spectra
| |
The nonlinear spectrum is an extension of the linear spectrum to systems that behave nonlinearly. Different methods of selecting the yield strength of the systems lead to several types of nonlinear spectra such as “constant strength”, “constant ductility”, and "constant damage" spectra.
Bispec supports several types of nonlinear spectra: “constant strength”, “constant R”, “constant ductility”, and "constant damage index" spectra. Some examples are shown in Figure 15 (Figure 16 is a screenshot of the actual spectral results window in Bispec). Figure 15a shows an example of constant strength spectra. This is illustrated in the constant lines on the yield strength plot. The resulting ductilities are plotted to the right, and show that higher ductilities are generally obtained for low strength values and short periods. Figure 15b shows constant ductility spectra. The strengths that result in the constant ductilities (right plot) are shown in the left plot, and indicate that higher strengths are required at shorter periods, and for lower ductility demands. The inverse relationships between ductility and strength and between ductility and period are illustrated in Figure 15c, which shows that ductility decreases with increasing period and strength.
An alternative to plotting multiple spectra on a two-dimensional plot is to represent the results as a three-dimensional surface with two parameters on the horizontal axes. As an example, Figure 17 shows three-dimensional plots of the spectral displacement demand of Figure 16 as a function of both period and strength.
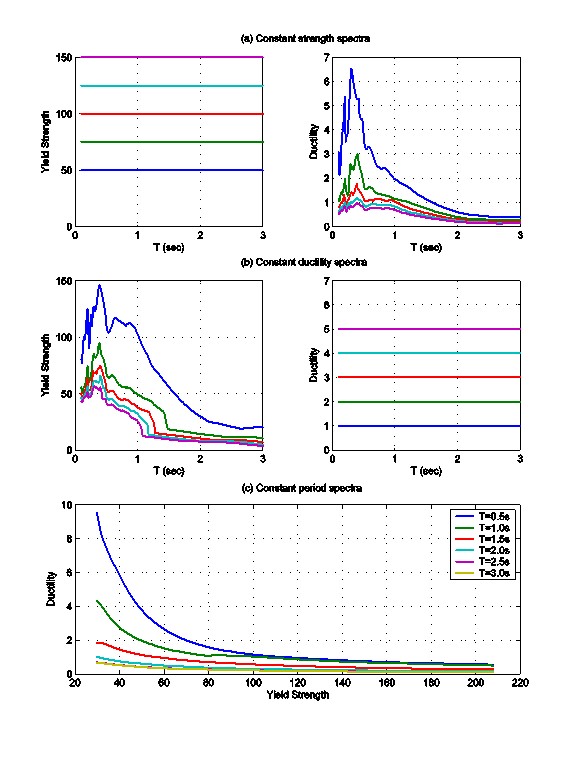
Figure 15: Constant strength and constant ductility spectra for the Northridge Rinaldi record.
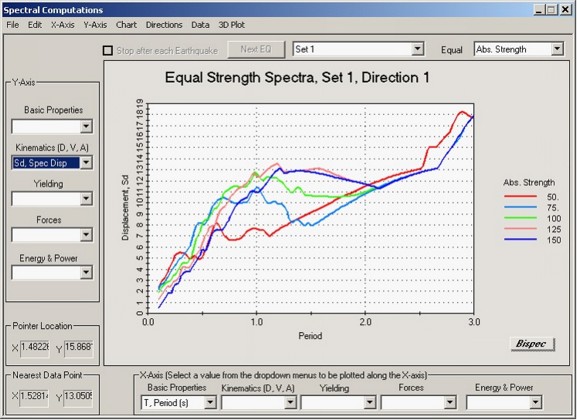
Figure 16: Spectral results screen in Bispec.
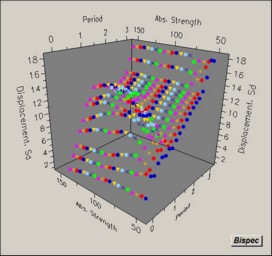

Figure 17: Three dimensional plot of spectral displacement vs. strength and period generated in Bispec.