|
Linear Spectra
|   |
|
Linear Spectra
| |
The typical linear response spectrum represents an envelope of the peak responses of many sdof systems with different periods. The acceleration response spectrum of a ground motion is a relationship between the natural period of vibration of a sdof system and the maximum absolute acceleration that it experiences under the ground motion. Similarly, a displacement response spectrum represents the peak displacement, relative to the ground, of many sdof systems with different periods. Hence, the construction of a response spectrum involves the analysis of many different sdof systems. The value of each point on the spectrum is the peak response of a single degree of freedom system of a given period. This is illustrated in Figure 1, where the displacement spectrum of a ground motion record from the 1986 Palm Spring earthquake is shown, along with the time history response for several periods. The relationship between the peak response at the different periods and the spectrum is graphically illustrated.
For linear spectra, a sdof is uniquely defined by a natural period and a damping ratio. The damping is usually assumed to be viscous, and it generally falls in the range of 2% to 5% of the critical damping for structures responding linearly. Higher damping values may be used if a linear analysis is used to predict the response of structures expected to yield. A higher amount of viscous damping leads to more energy dissipation due to damping, which accounts for the energy dissipated by yielding structures.
The most commonly used forms of linear spectra are acceleration spectra “Sa” (Sa vs. T), displacement spectra “Sd” (Sd vs. T) and velocity spectra “Sv” (Sv vs. T). Other commonly used spectral values are pseudo-acceleration spectra “PSa” and pseudo-velocity spectra “PSv”, which are easily derived from the displacement spectra using the following equations:
 (Equation-5)
Figure 2 shows plots of PSa, PSv, and Sd vs. T. Also shown is a plot of PSa vs. Sd, which is another spectral representation commonly referred to as the ADRS spectrum.
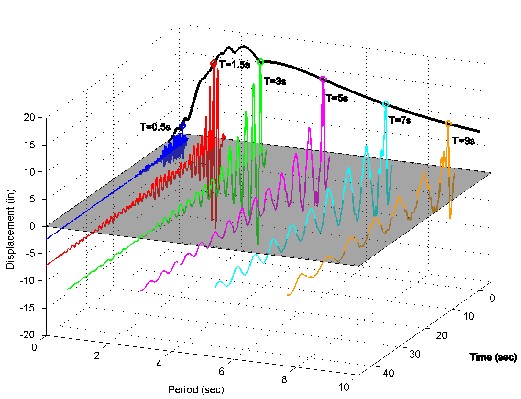
Figure 13: Construction of linear displacement spectra for a record from the 1986 Palm Springs earthquake (SAC record LA20). The displacement histories are shifted to make the peak displacements coincide with the time origin.
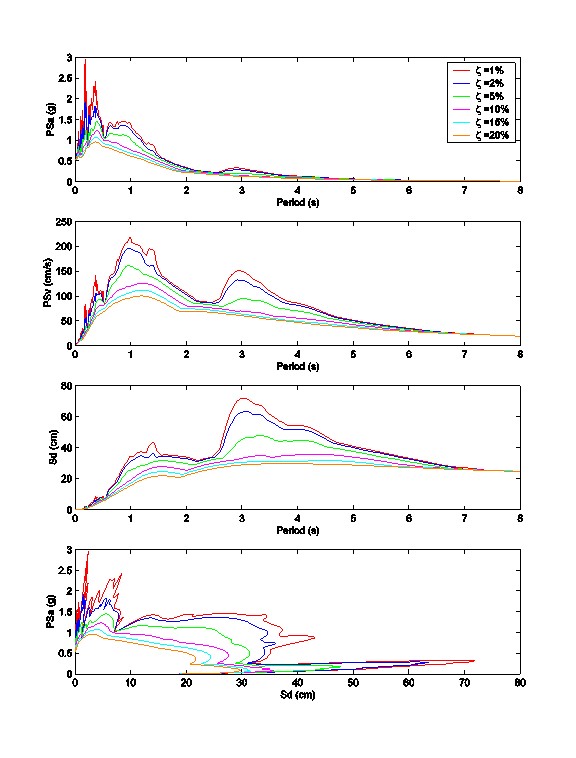
Figure 14: PSa, PSv, Sd and ADRS spectra of the 1994 Northridge Rinaldi record for different damping levels.
